


The Power of Fractals in Stock Chart Analysis
And how they can transform your buy decisions
Benoit Mandelbrot, a visionary mathematician, introduced the world to the fascinating concept of fractals. These intricate and self-replicating geometric patterns have found applications in various fields, including finance.
Fractals, as defined by Mandelbrot, are complex geometric shapes that exhibit self-similarity across different scales.
In simpler terms, a fractal pattern looks similar, whether you zoom in or out. In financial markets, fractals manifest as repetitive patterns in price movements.
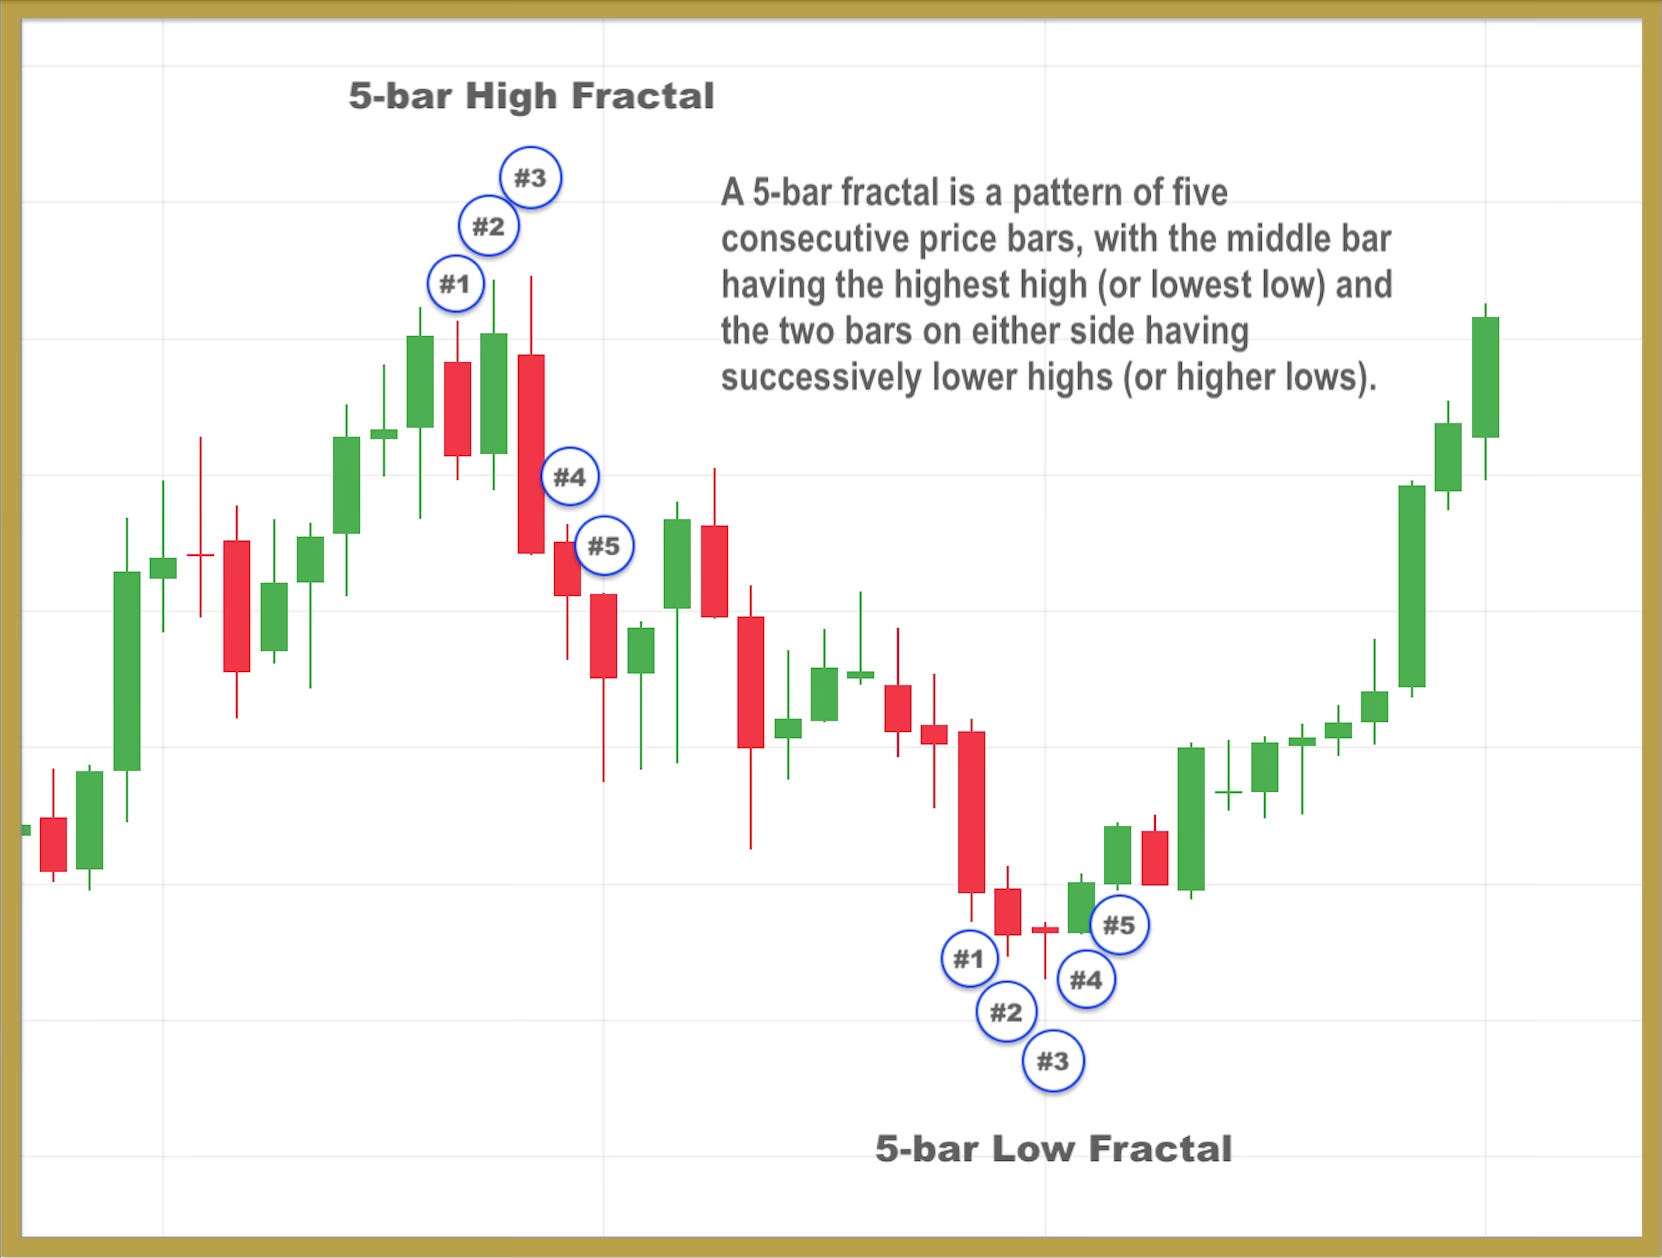
The concept of the 5-bar fractal in stock charts is often associated with Bill Williams who introduced the idea of fractals as part of his trading system, which he described in his book "Trading Chaos."
According to Williams, a 5-bar fractal is a pattern of five consecutive price bars, with the middle bar having the highest high (or lowest low) and the two bars on either side having successively lower highs (or higher lows). Fractals are used in technical analysis to identify potential reversal points in the price trend.
Fractals can be employed to identify the structure of market trends. Traders use fractal patterns to recognize recurring formations in price charts, helping them understand the underlying dynamics of the market.
Fractals are adept at pinpointing potential reversal points. Traders look for fractal patterns, such as the well-known "M" or "W" shapes, which may indicate an impending shift in market direction.
Fractals contribute to the identification of support and resistance levels. Peaks and troughs in fractal patterns can serve as markers for significant price levels, assisting traders in making informed decisions.
The self-similar nature of fractals allows traders to assess market volatility. The degree of intricacy in fractal patterns can be indicative of the level of volatility in a particular market or asset.
Fractals can be applied across various timeframes. Consider your trading strategy and objectives when choosing the timeframe that aligns with your goals.
Look for repeating patterns in price charts, such as the appearance of smaller versions of a pattern within a larger one. Recognising these patterns can be a powerful tool for anticipating market movements.
Enhance your analysis by combining fractals with other technical indicators. This comprehensive approach can provide a more holistic view of market conditions and increase the accuracy of your predictions.
Fractals offer a unique lens through which traders can analyze stock charts. By identifying patterns that repeat across different scales, fractals provide valuable insights into market structure, reversal points, and support/resistance levels. As you navigate the complexities of financial markets, consider incorporating fractal analysis into your toolkit for a more nuanced and comprehensive understanding of price movements.
In the world of trading, where patterns and trends often dictate decisions, Mandelbrot's fractals provide a powerful framework for unraveling the intricate tapestry of market dynamics. Explore the beauty of self-similarity and harness the potential of fractals to elevate your stock chart analysis.