


The Golden Cross, a powerful technical indicator in the realm of stock trading, occurs when a stock's 50-day moving average crosses above its 200-day moving average.
In this article, we unravel the dynamics of the Golden Cross, delving into its origins, principles, and the significant advantages it offers to traders seeking to identify strategic buying and selling opportunities in the stock market.
Understanding the Golden Cross
The Golden Cross is a key technical signal that holds immense significance for traders and investors.
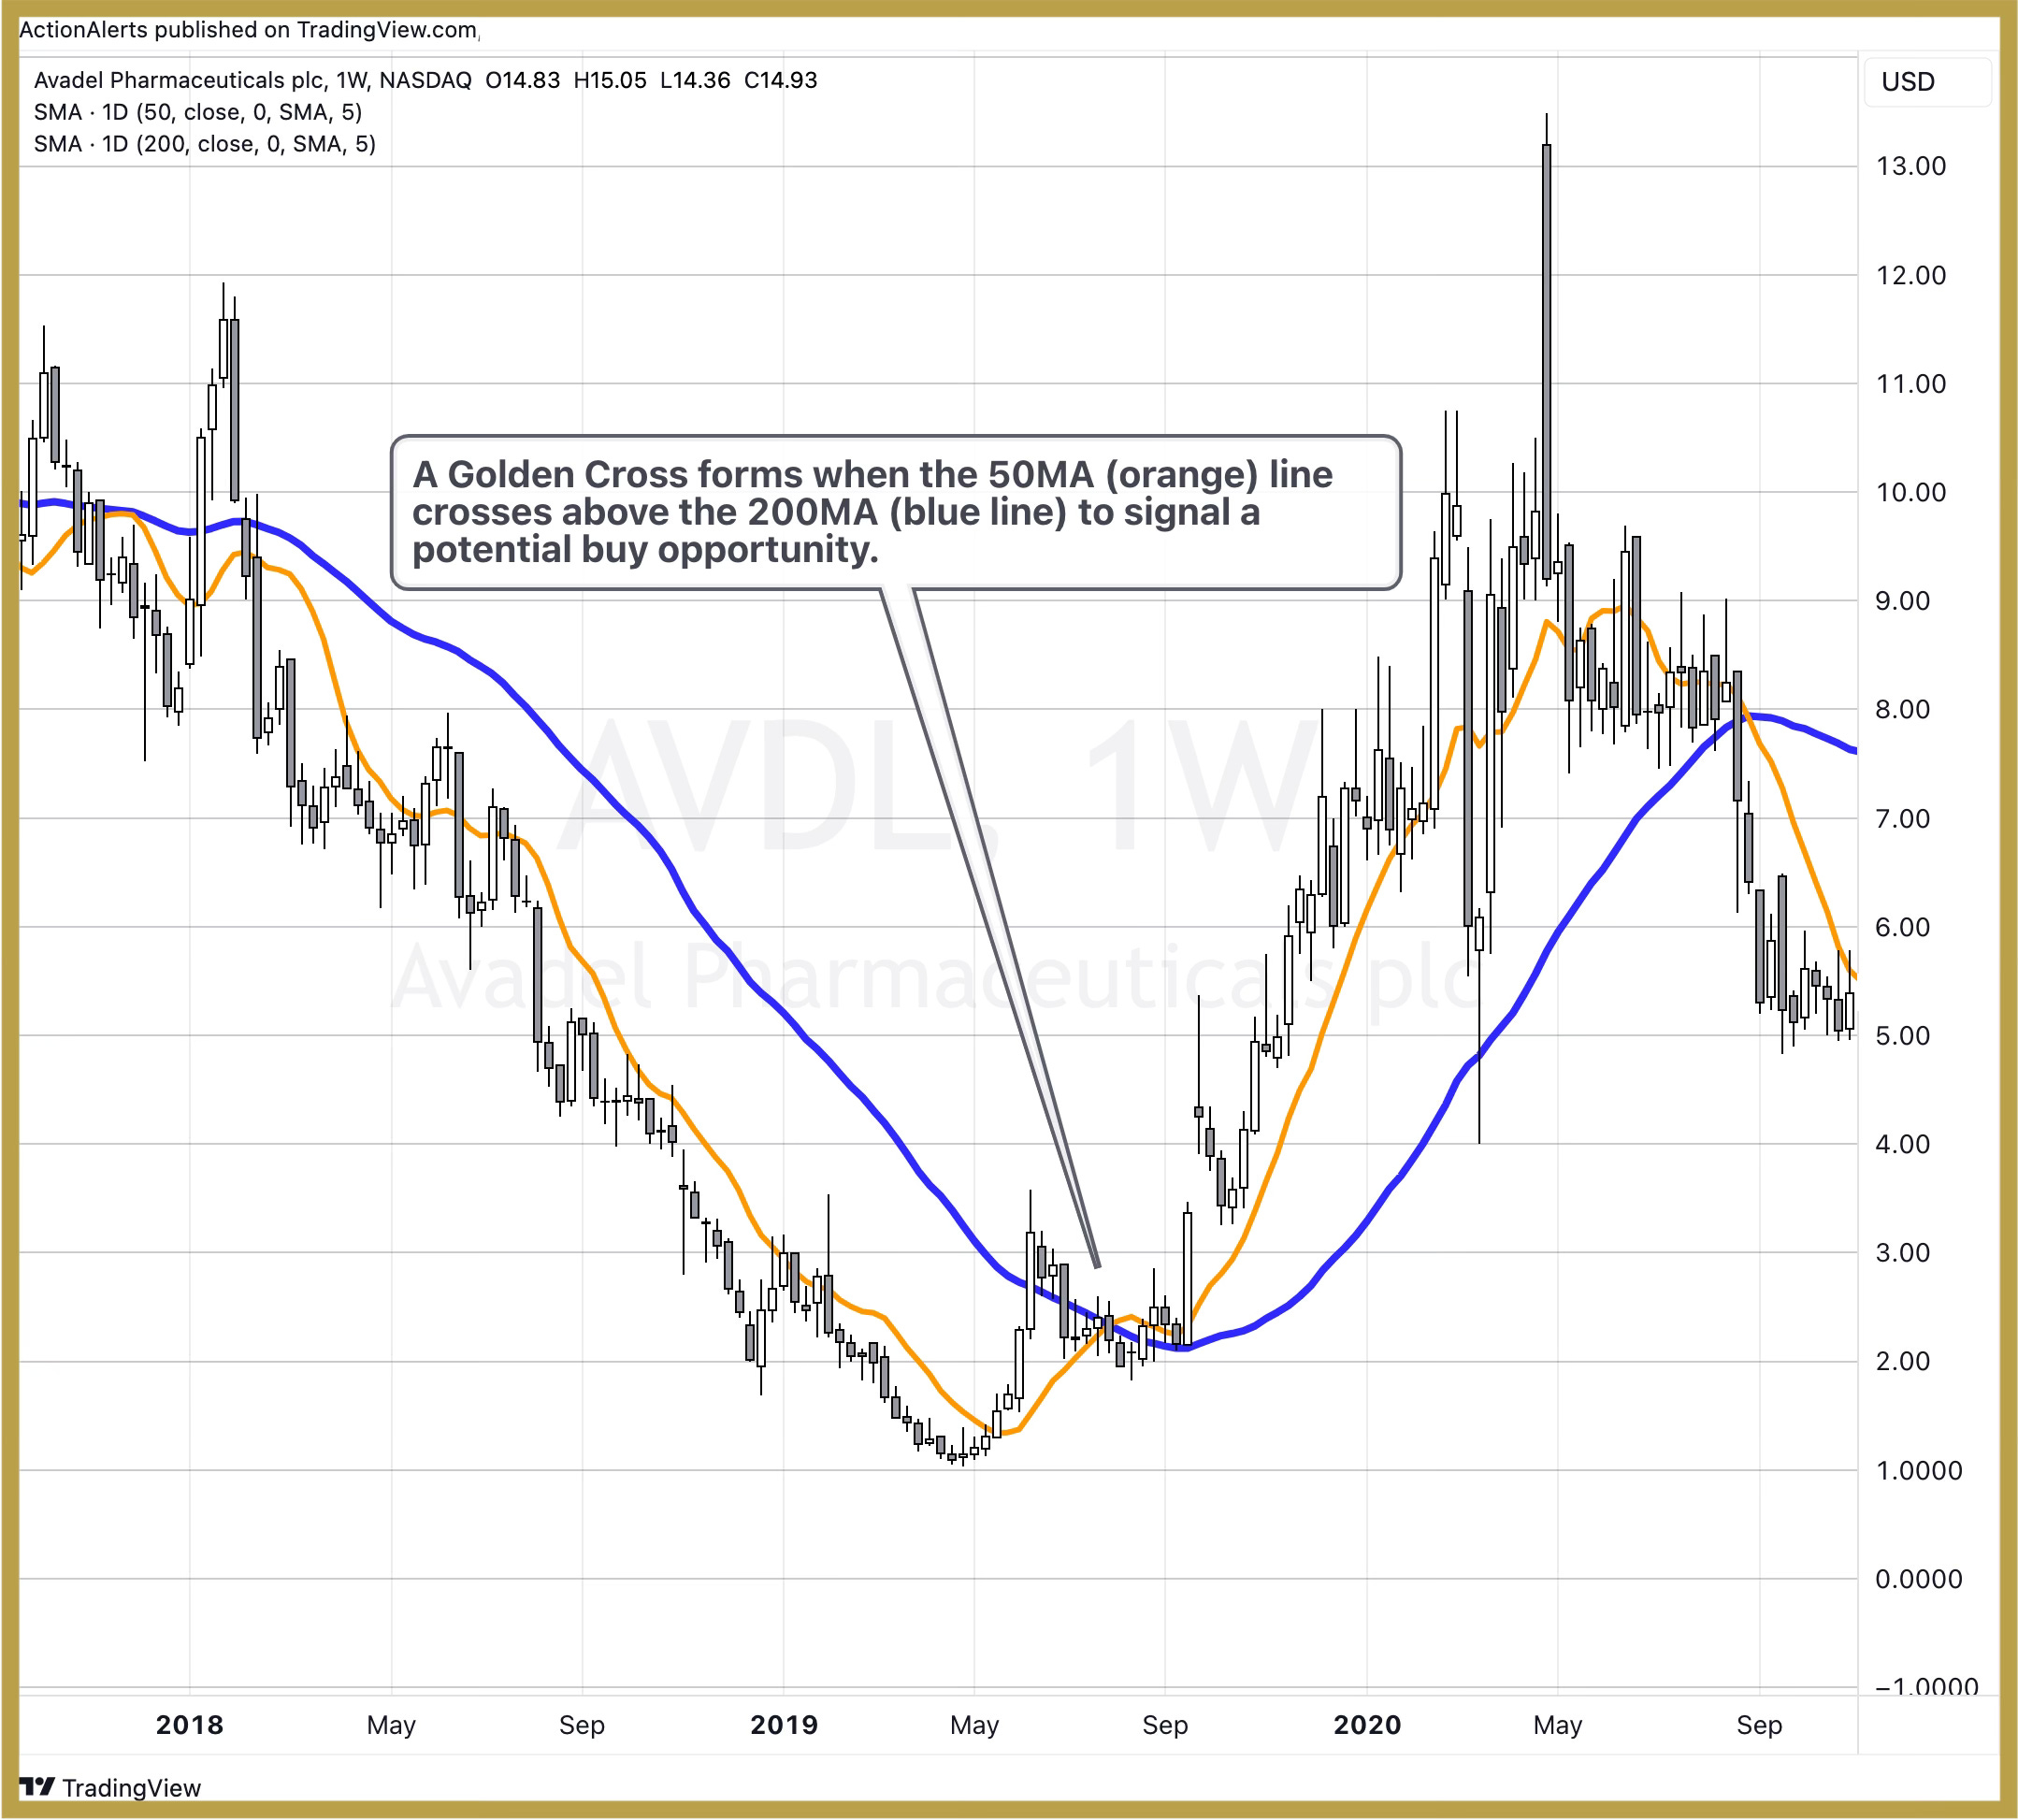
It occurs when the short-term moving average, typically the 50-day moving average, crosses above the long-term moving average, commonly the 200-day moving average.
This event is regarded as a bullish signal, signaling a potential shift in the stock's trend dynamics.
Construction of the Golden Cross:
50-Day Moving Average (SMA or EMA): Represents the average closing prices of the stock over the past 50 trading days. A short-term moving average designed to capture recent price movements.
200-Day Moving Average (SMA or EMA): Reflects the average closing prices of the stock over the past 200 trading days. A long-term moving average providing a smoothed representation of the stock's historical price trends.
When the 50-day moving average crosses above the 200-day moving average, it creates a crossover pattern, forming the Golden Cross. This occurrence is considered a bullish signal, suggesting a potential upward momentum in the stock's price.
Advantages of the Golden Cross Indicator
1. Trend Reversal Signal:
One of the primary advantages of the Golden Cross is its ability to signal a potential reversal in the stock's trend.
The crossover of the short-term moving average above the long-term moving average indicates a shift from a bearish to a bullish trend.
2. Confirmation of Bullish Momentum:
The Golden Cross provides confirmation of bullish momentum in the stock.
Traders and investors interpret this signal as an indication that the recent positive price movements are not merely a short-term fluctuation but may represent a more sustained upward trend.
3. Long-Term Trend Strength:
As the Golden Cross involves the 200-day moving average, which reflects the long-term trend, it provides insight into the overall strength and sustainability of the stock's price movement.
This can be particularly valuable for investors with a focus on long-term positions.
4. Enhanced Confidence in Buying Opportunities:
Traders often gain increased confidence in buying opportunities when they observe a Golden Cross. The crossover of the short-term moving average above the long-term moving average is seen as a decisive moment to enter a long position.
5. Reduced Noise and False Signals:
The use of longer-term moving averages, such as the 200-day moving average, helps reduce the impact of short-term market noise and false signals.
The Golden Cross, based on a more extended timeframe, is less susceptible to temporary fluctuations.
6. Risk Mitigation with Trend Confirmation:
Traders who wait for confirmation through the crossover before entering a trade may avoid premature entries and reduce the risk of acting on false signals.
7. Applicability Across Different Timeframes:
The Golden Cross is a versatile indicator applicable across various timeframes.
Whether traders are engaged in short-term or long-term strategies, the Golden Cross can be adapted to align with their preferred trading horizons.
8. Widespread Recognition and Impact:
The Golden Cross is widely recognized in the financial markets, making it a signal that attracts attention from a broad spectrum of traders and investors.
The collective response to this indicator can contribute to increased market activity.
Implementing the Golden Cross Strategy
To leverage the advantages of the Golden Cross indicator, traders and investors follow a systematic approach:
Monitor Moving Average Crossover: Keep a close eye on the crossover of the 50-day moving average above the 200-day moving average. This event marks the formation of the Golden Cross.
Confirm with Price Action: Confirm the Golden Cross signal with positive price action. Ideally, look for an increase in trading volume accompanying the crossover to strengthen the reliability of the signal.
Evaluate Overall Market Conditions: Consider the broader market conditions and trends to contextualise the Golden Cross signal. A Golden Cross in an overall bullish market may carry more significance.
Implement Risk Management: As with any trading strategy, implement risk management practices. Set stop-loss orders and define risk tolerance levels to manage potential downsides.
Consider Additional Technical Indicators: Enhance the analysis by incorporating other technical indicators or chart patterns to gain a comprehensive view of the stock's potential trajectory.
The Golden Cross, with its ability to signal trend reversals, confirm bullish momentum, and provide insights into long-term trend strength, remains a formidable tool in the arsenal of traders and investors.
Recognizing the advantages of the Golden Cross as a reliable indicator for strategic buying and selling opportunities empowers market participants to make informed decisions in the ever-evolving landscape of the stock market.
As trends unfold and dynamics shift, mastering the art of interpreting the Golden Cross can be a valuable skill for those seeking success in stock trading.
Get alerted when stocks are triggered by a Golden Cross signal: