

The Cup and Handle Pattern
A reliable indicator for future price movements
The financial markets, with their complexities and intricacies, often present a myriad of patterns and indicators that investors use to make informed decisions.
Among these patterns, the "cup and handle" stands out as one of the most reliable and widely recognised.
When a stock's chart displays this formation, it can signal a potentially lucrative buying opportunity.
Understanding why and how to act on this pattern can provide investors with a significant edge in the market.
What is the Cup and Handle Pattern?
The cup and handle pattern is a technical chart formation that resembles the shape of a teacup.
It consists of two main parts: the cup, which is a rounded bottom, and the handle, which is a smaller consolidation period that typically occurs after the cup has formed.
The cup resembles a "U" shape, where the stock price gradually declines, forms a bottom, and then rises back to the previous level.
This formation usually indicates a period of consolidation where the stock finds a support level and builds a base.
The handle appears as a short period of consolidation or a slight downward drift following the cup's completion.
This handle is a crucial part of the pattern as it often represents a final shakeout of weak holders before a potential breakout to the upside.
Why the Cup and Handle Pattern is Significant
The cup and handle pattern is considered a bullish continuation pattern.
This means that it often forms during an uptrend and signals that the existing uptrend is likely to continue.
The pattern is rooted in investor psychology and market dynamics, which makes it a reliable indicator for future price movements:
Investor Sentiment and Market Psychology
The formation of the cup indicates a period where the stock price corrects and then stabilizes.
This consolidation period allows the stock to find a bottom and flush out weak hands.
The gradual rise forming the right side of the cup suggests that buying interest is returning.
When the handle forms, it represents a mild pullback or consolidation, reflecting a momentary hesitation among investors.
However, this phase often acts as a final accumulation point for savvy investors before the stock breaks out.
Support and Resistance Levels
The cup and handle pattern often forms around key support and resistance levels.
The bottom of the cup represents a strong support level where buying interest emerges, preventing the stock from falling further.
The rim of the cup, which is the peak before the handle forms, acts as a resistance level.
Once the handle forms and the stock price breaks above this resistance, it signals a potential breakout and continuation of the uptrend.
When to Consider a Buy Order
Identifying the cup and handle pattern on a stock chart is only part of the equation. Knowing when to place a buy order is crucial to capitalize on this pattern effectively:
1. Completion of the Handle
The optimal time to consider a buy order is when the stock price breaks above the resistance level formed by the rim of the cup.
This breakout point is a strong buy signal as it indicates that the stock has overcome the last level of resistance and is likely to continue its upward trajectory.
2. Volume Confirmation
Volume plays a critical role in confirming the validity of the cup and handle pattern.
During the formation of the cup, trading volume typically decreases, indicating a period of consolidation and reduced selling pressure.
As the handle forms, volume may remain low or slightly increase.
However, the real confirmation comes during the breakout.
A significant increase in volume during the breakout suggests strong buying interest and increases the likelihood of a sustained move higher.
3. Technical Indicators
In addition to the pattern itself and volume confirmation, traders often use other technical indicators to enhance their decision-making.
When the stock price breaks out above the rim of the cup, it often coincides with the stock crossing above key moving averages, such as the 50-day or 200-day moving average.
Indeed, Mark Minervini has gone further in developing his Trend Template to ensure that an entry has the best chance of success.
Two examples
The effectiveness of the cup and handle pattern in identifying profitable buying opportunities is well illustrated by Apple Inc. (AAPL) which has exhibited this pattern multiple times over the years, often preceding significant price increases.
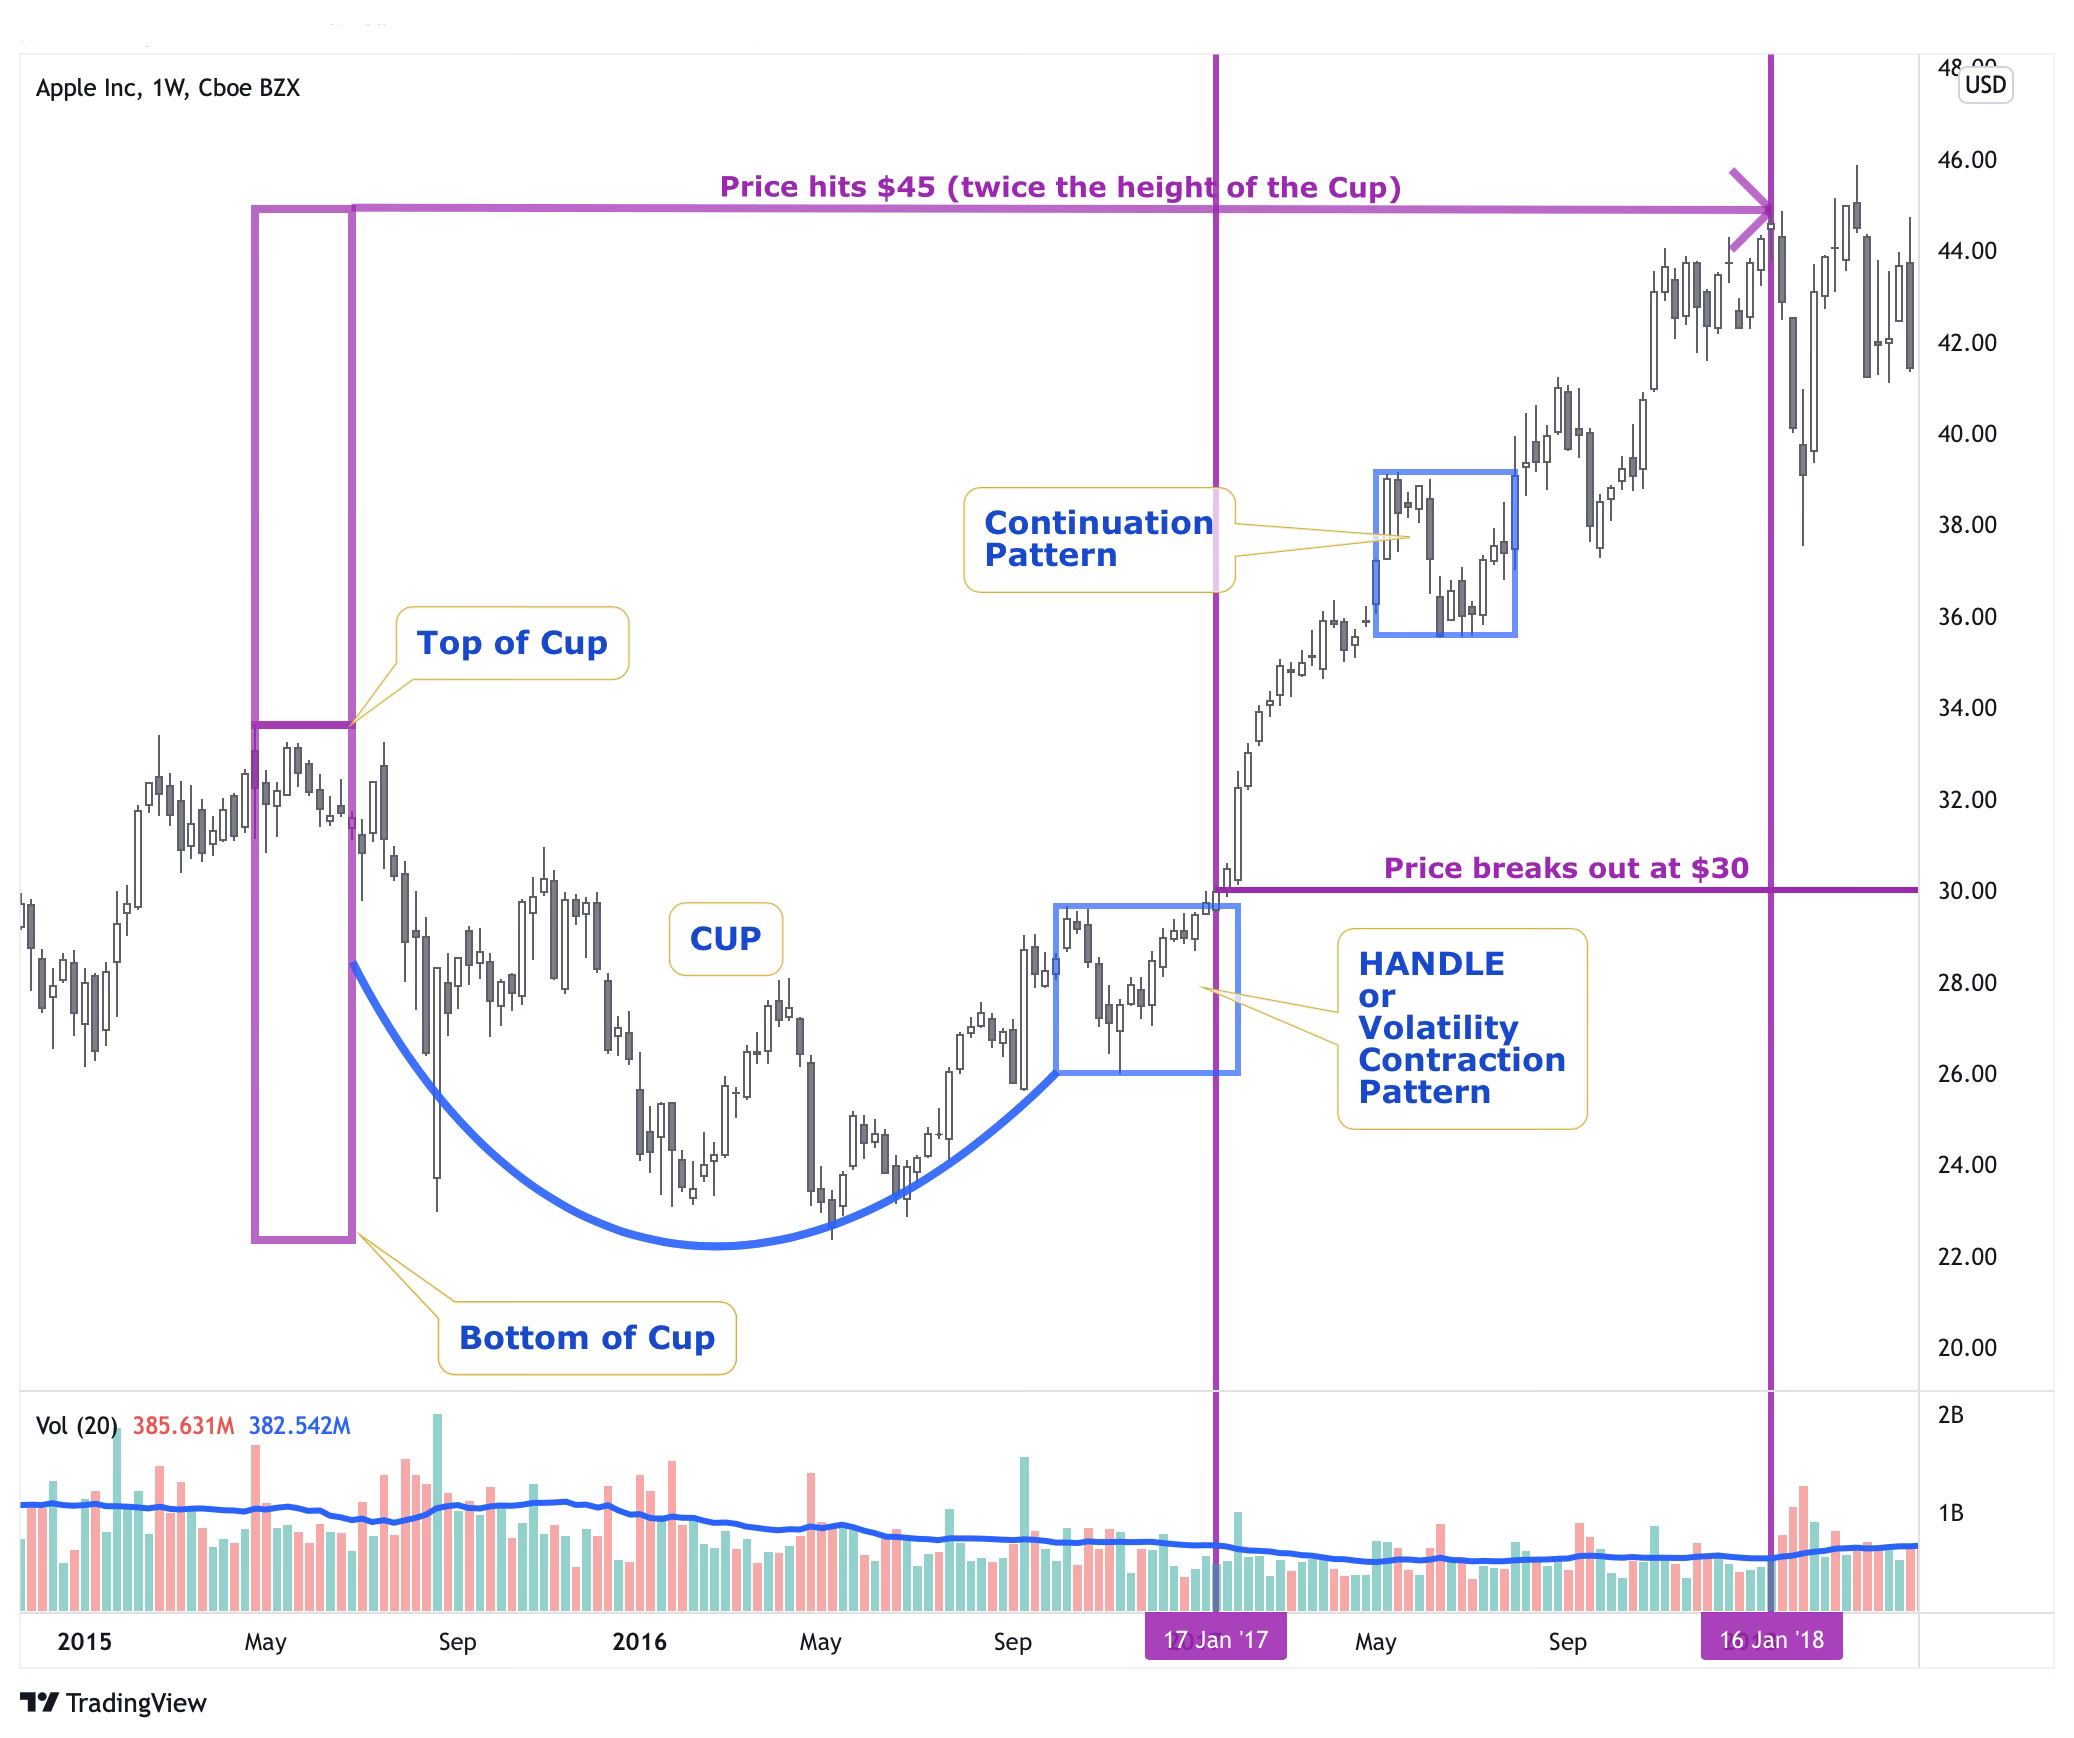
The illustration above shows how the Apple stock price formed a “cup” between May 2015 and September 2016.
The “handle” formed in the last quarter of 2016 and price broke out to the upside in mid-January 2017.
Within a year price had increased by 50%.
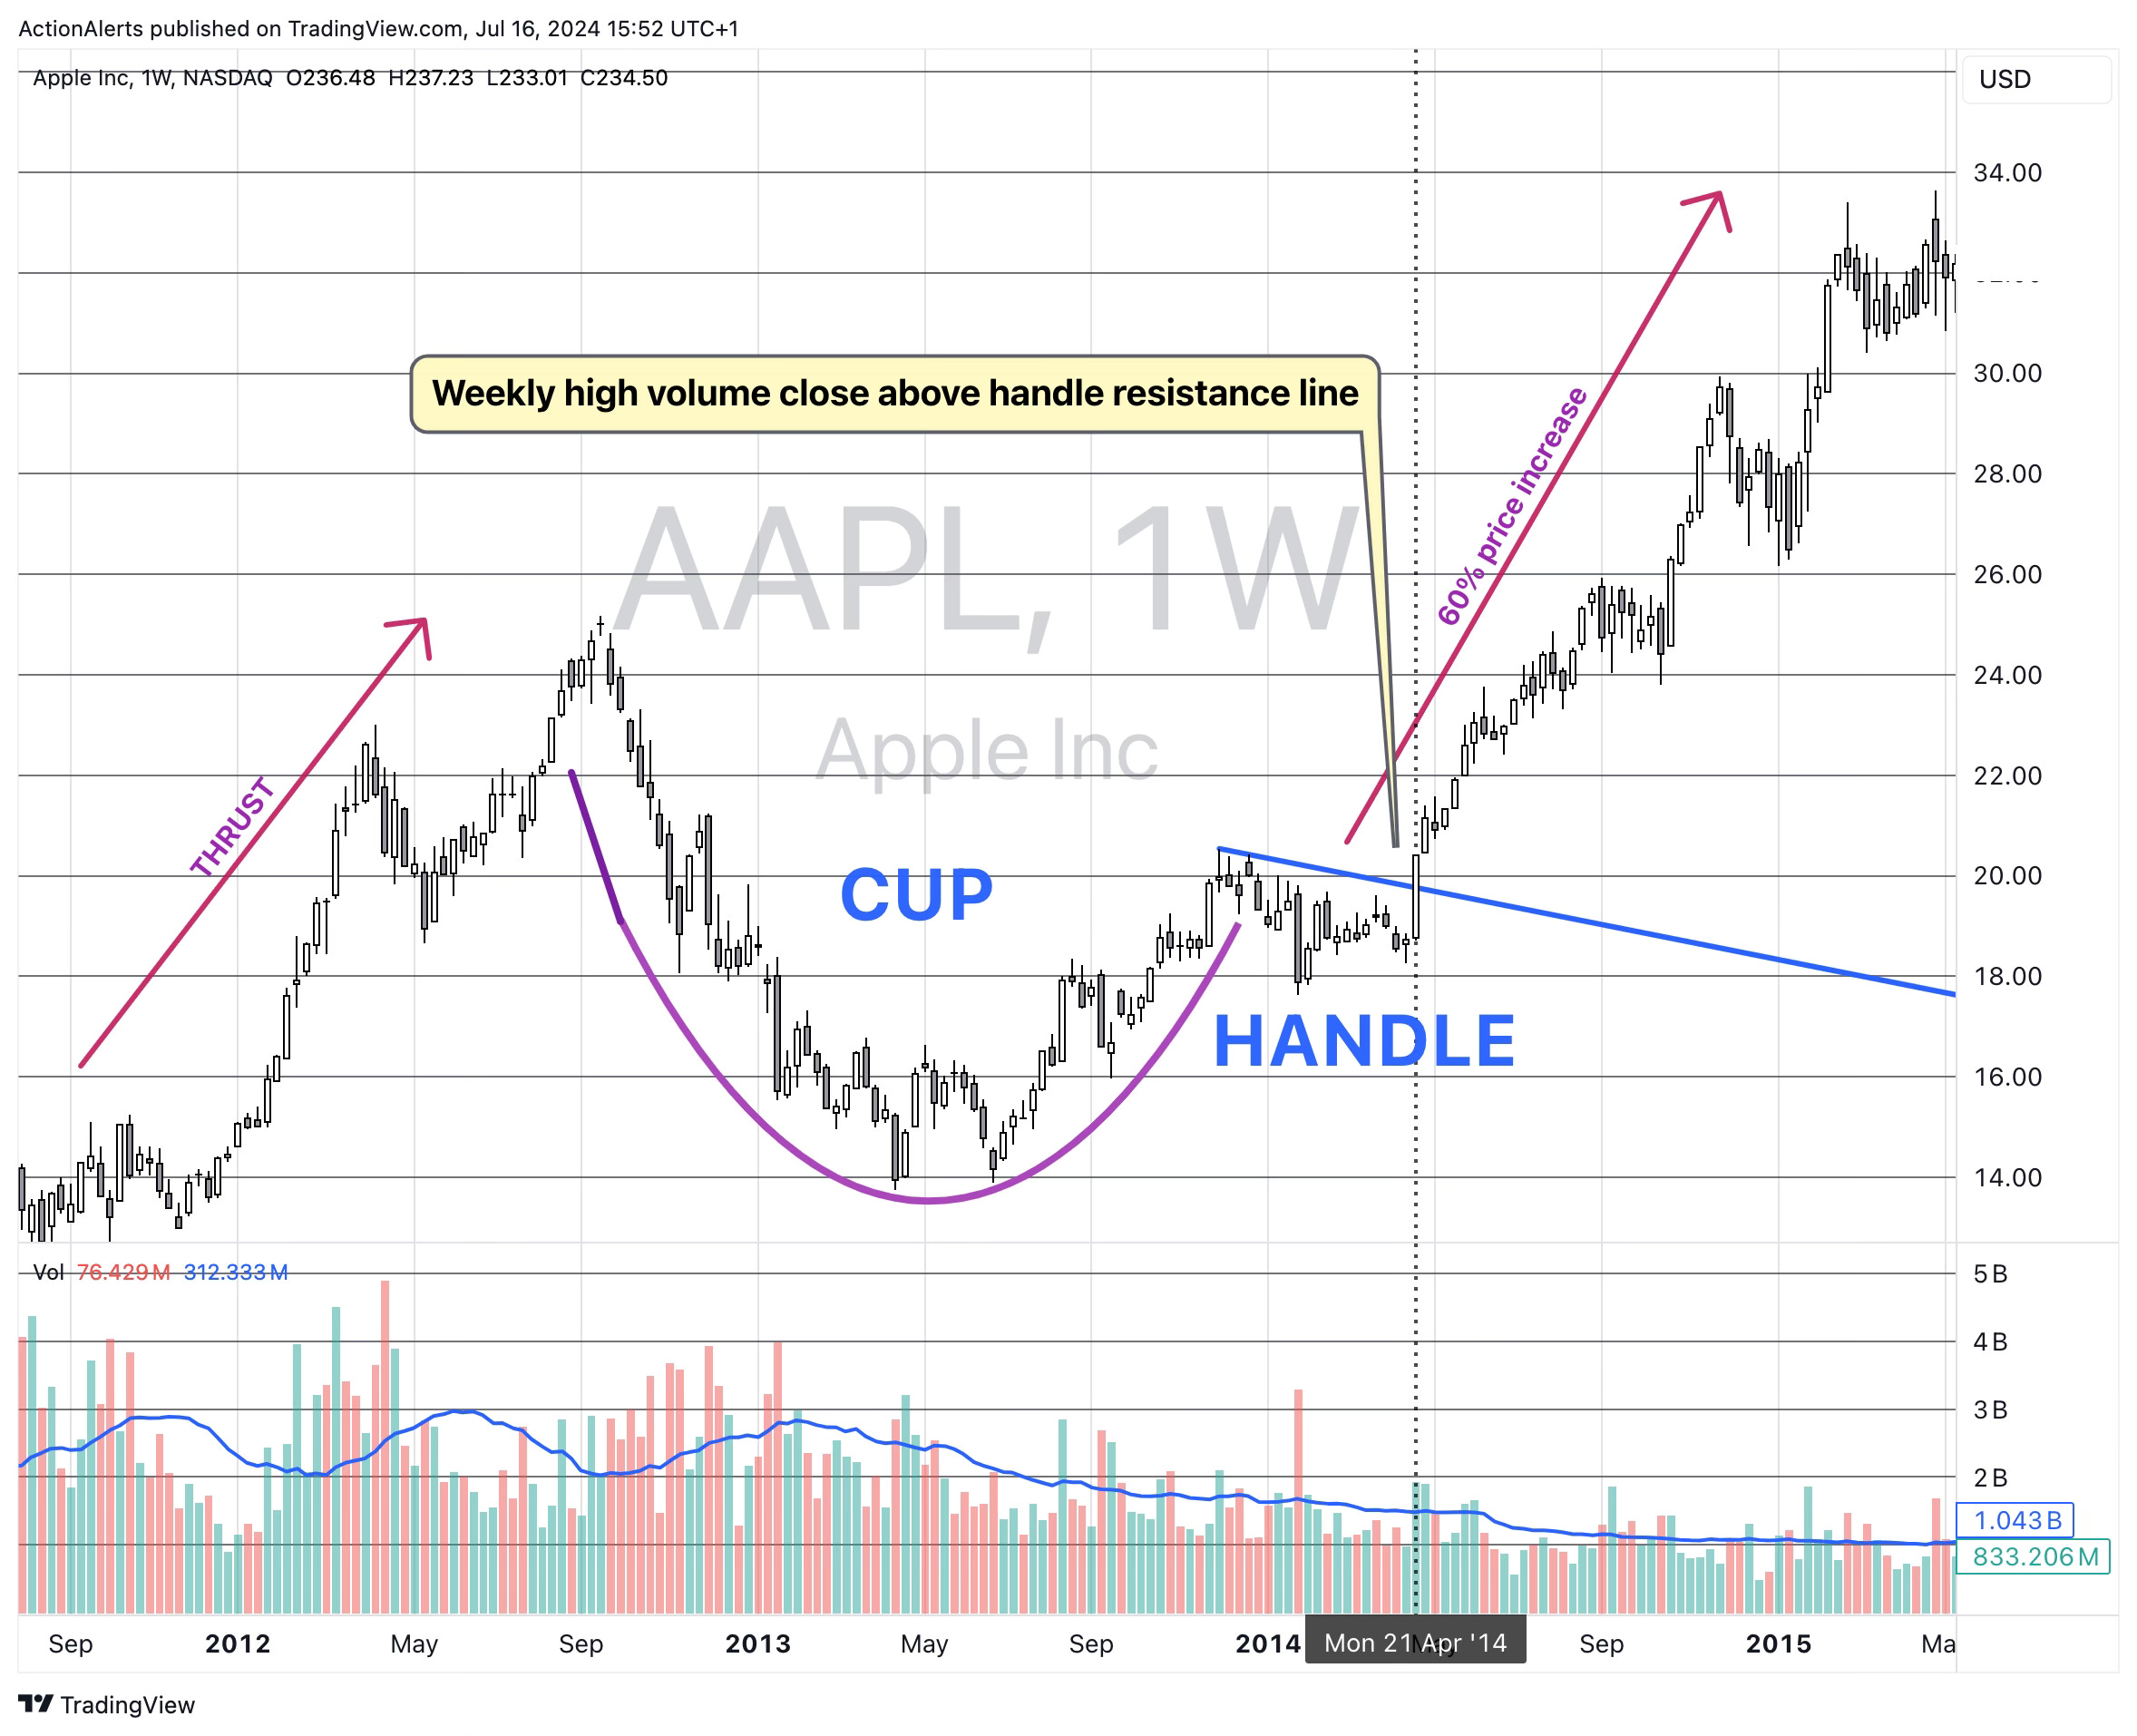
In the above example, Apple formed a “cup” over a period of about 15 months.
This time the “handle” sloped down for about 5 months.
Once price closed above the resistance line on high volume it again took a year to gain 60%.
Risk Management and Considerations
It should never be forgotten that no pattern is foolproof, and false breakouts can and do occur.
While the cup and handle pattern can be a powerful tool, it is essential to approach it with proper risk management strategies.
To mitigate risks, investors should consider the following:
1. Setting Stop-Loss Orders
Placing stop-loss orders just below the handle's low or the breakout point can help limit potential losses if the breakout fails.
This approach ensures that investors have a predefined exit strategy in case the trade does not go as planned.
2. Position Sizing
Proper position sizing is crucial to managing risk.
Investors should avoid putting too much capital into a single trade, regardless of how promising the pattern appears.
Diversifying investments and adhering to a well-defined risk management plan can help protect the overall portfolio.
3. Monitoring Market Conditions
Market conditions can and will influence the success of the cup and handle pattern.
During periods of high volatility or bearish market sentiment, even the most promising patterns can fail.
Staying informed about broader market trends and economic indicators can provide valuable context for trading decisions.
Conclusion
The cup and handle pattern is a time-tested formation that can provide investors with a strategic advantage in identifying buying opportunities.
Rooted in investor psychology and market dynamics, this pattern signals a period of consolidation followed by a potential breakout.
By understanding the components of the cup and handle, recognizing the optimal time to place a buy order, and employing sound risk management strategies, investors can enhance their chances of success in the financial markets.
However, it is essential to remember that no single pattern or indicator guarantees success.
Combining the cup and handle pattern with other technical and fundamental analysis tools can provide a more comprehensive approach to making informed investment decisions.
As with any trading strategy, continuous learning, practice, and adaptation to changing market conditions are key to achieving long-term success.