


Chester W. Keltner's Keltner Channels Indicator
Mastering Market Dynamics
Chester W. Keltner, a prominent figure in the realm of technical analysis, introduced the financial community to the Keltner Channels indicator—an influential tool for identifying strategic entry and exit points in stock trading.
In this article, we delve into the origins of the Keltner Channels, uncover their underlying principles, and discuss the significant advantages they offer to traders aiming to navigate the intricacies of the stock market.
The Legacy of Chester W. Keltner
Chester W. Keltner's impact on technical analysis is marked by his innovative contributions to market dynamics.
Born in 1909, Keltner's exploration of price movements led to the development of the Keltner Channels—a tool designed to capture and interpret volatility in the financial markets.
Understanding the principles behind this indicator provides traders with a valuable framework for making informed decisions.
Unveiling the Keltner Channels Indicator
The Keltner Channels indicator is a volatility-based tool designed to identify potential buying and selling opportunities in the market.
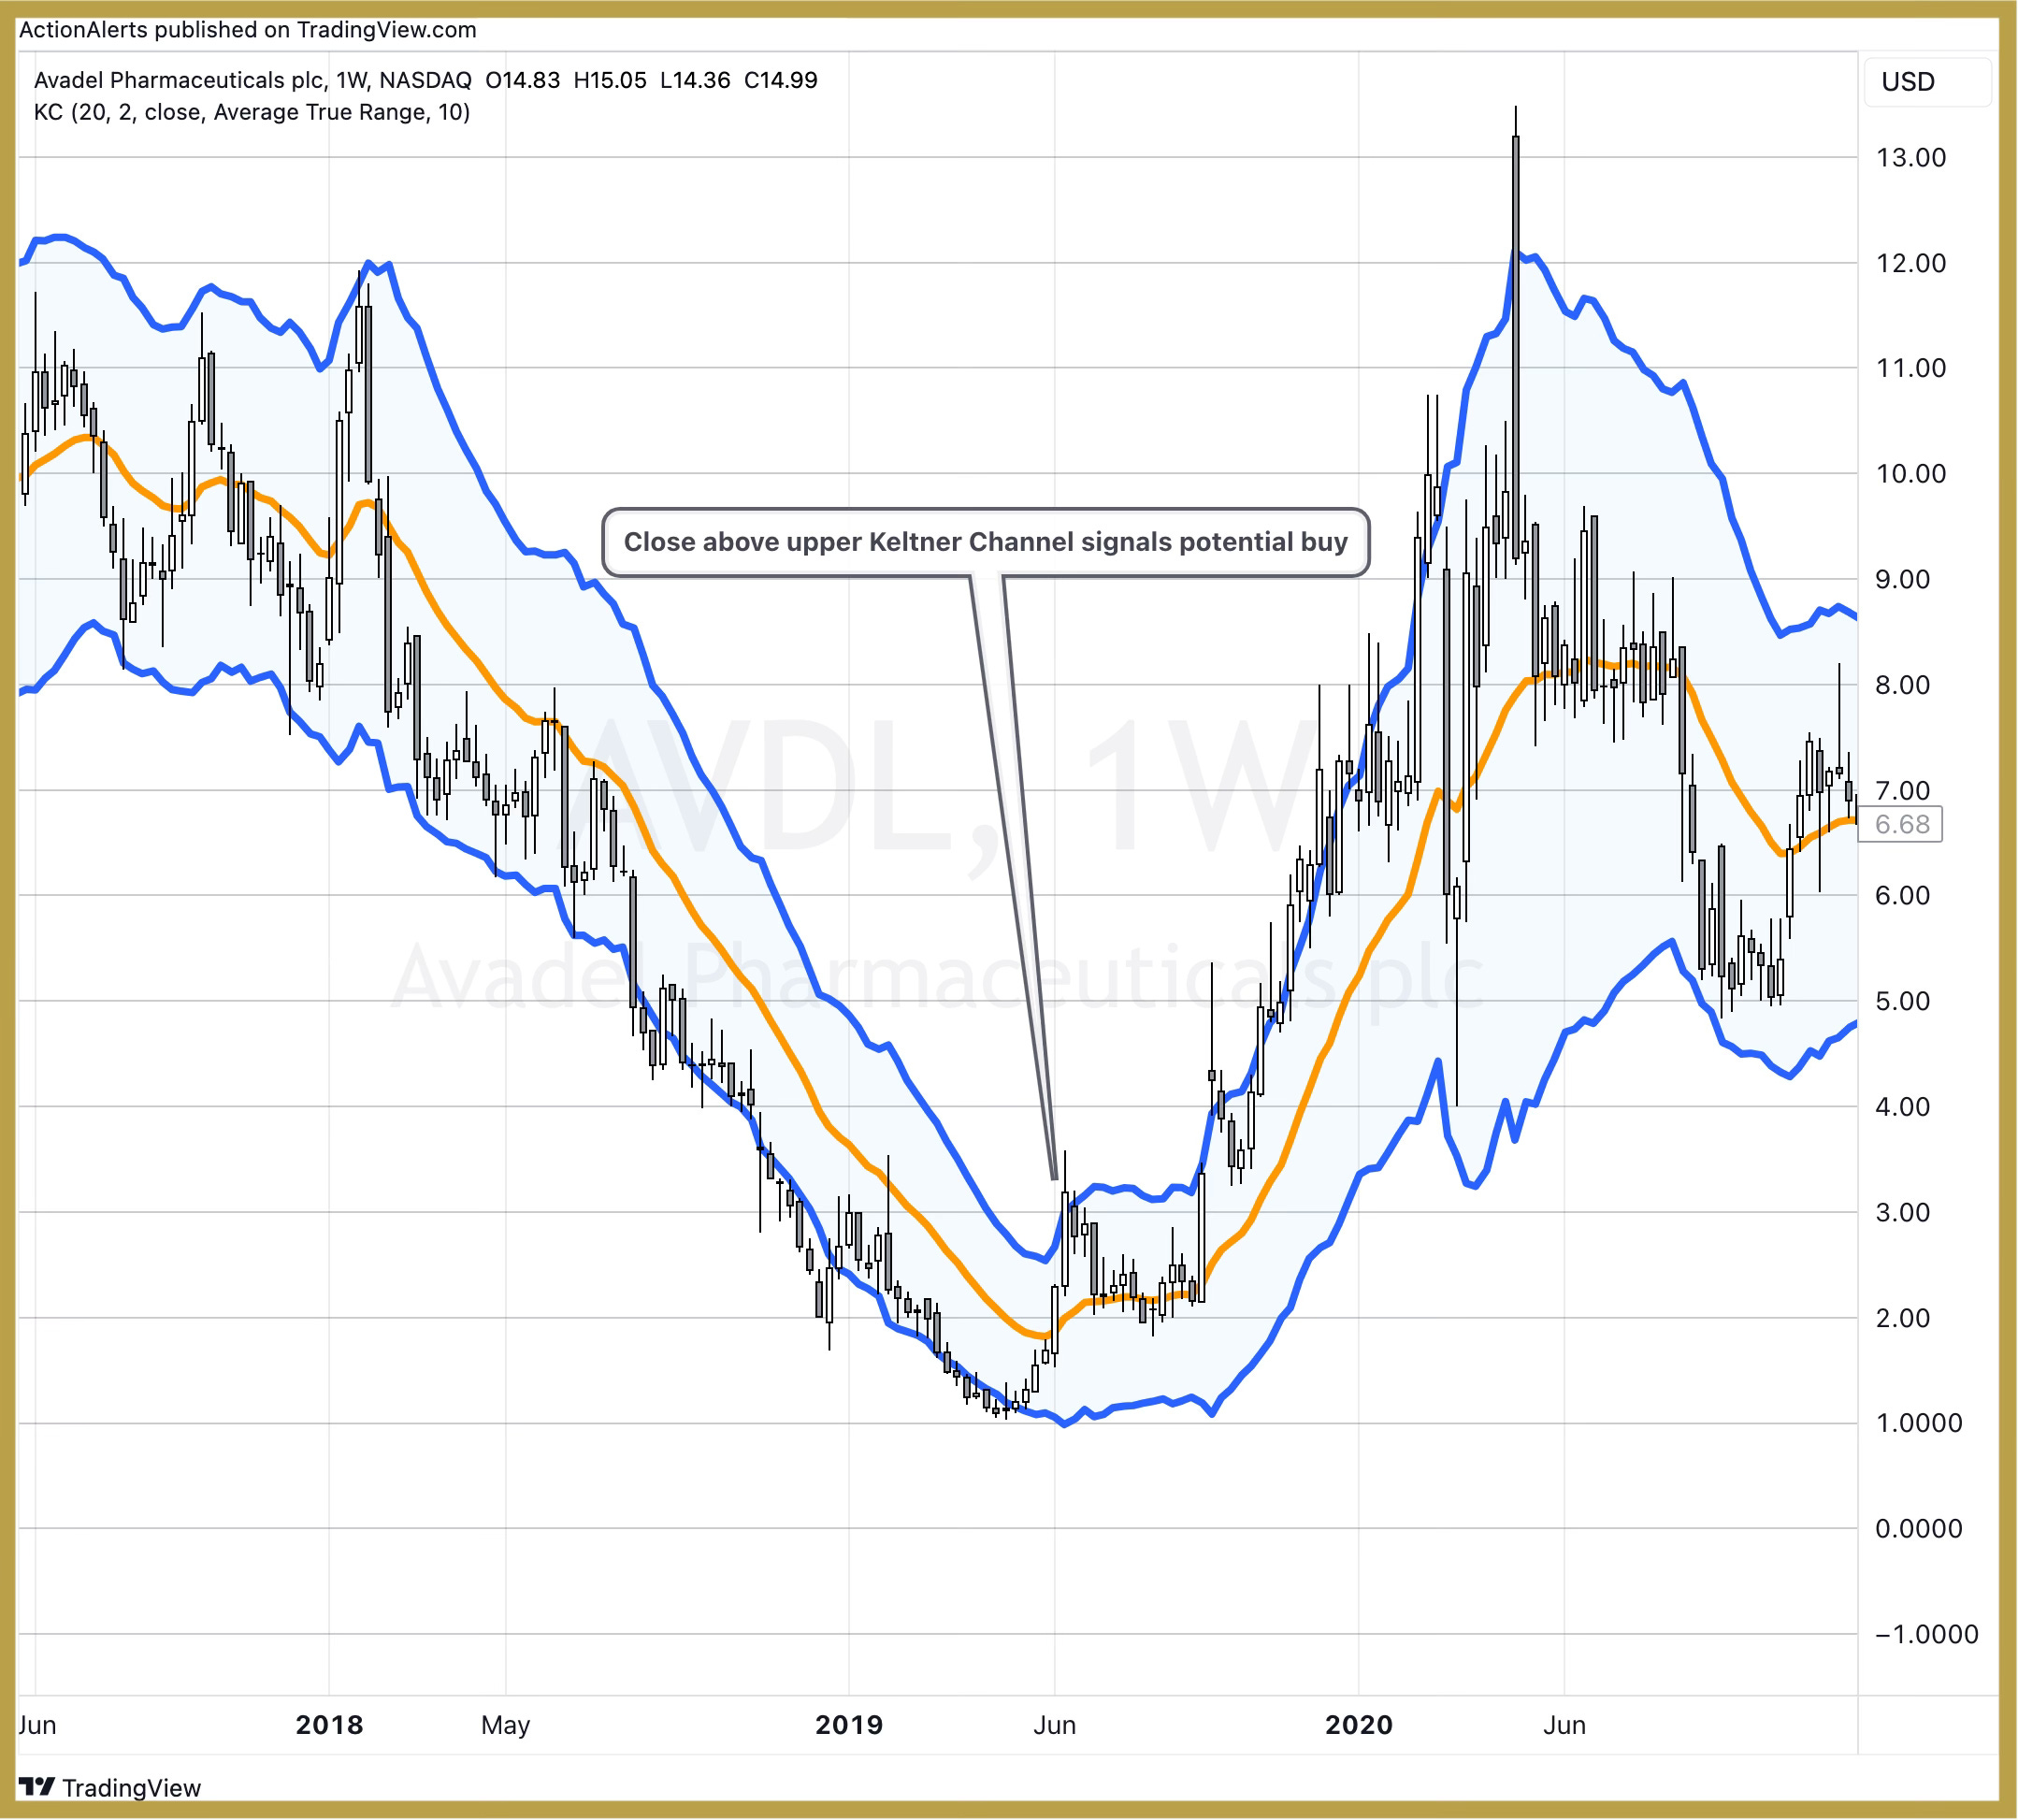
Consisting of three lines—a central moving average line and upper and lower channel lines—this indicator provides traders with a visual representation of price volatility and potential trend reversals.
Construction of Keltner Channels:
Central Moving Average (CMA): Calculated using an exponential moving average of the asset's typical price. Represents the centerline of the Keltner Channels.
Upper Channel Line: Derived by adding a multiple of the average true range (ATR) to the central moving average. Represents the upper boundary of price volatility.
Lower Channel Line: Obtained by subtracting a multiple of the ATR from the central moving average. Represents the lower boundary of price volatility.
The width of the channels is dynamic, adjusting to changes in market volatility. As volatility increases, the channels widen, providing a broader range for price fluctuations.
Advantages of the Keltner Channels Indicator
1. Volatility-Based Signals:
Keltner Channels excel in providing volatility-based signals. Traders can gauge the degree of market volatility by observing the width of the channels, helping them adapt their strategies to prevailing market conditions.
2. Clear Entry and Exit Signals:
The upper and lower channel lines serve as clear signals for potential entry and exit points. A price move above the upper channel signals a potential buying opportunity, while a move below the lower channel indicates a potential selling opportunity.
3. Trend Identification:
Keltner Channels assist traders in identifying trends and trend reversals. By observing the position of the price in relation to the central moving average, traders can discern the prevailing trend and anticipate potential reversals.
4. Dynamic Adjustments to Volatility:
The dynamic nature of the channels allows for adjustments based on market volatility. Traders benefit from a tool that adapts to changing conditions, ensuring relevance across various market environments.
5. Confirmation with Other Indicators:
Keltner Channels can be used in conjunction with other technical indicators to confirm signals. Traders often combine this tool with oscillators or trend-following indicators to enhance the reliability of their trading decisions.
6. Suitability for Different Timeframes:
Whether engaged in short-term or long-term trading, the Keltner Channels indicator is adaptable to different timeframes. This flexibility accommodates the preferences and objectives of a diverse range of traders.
7. Risk Management:
Chester W. Keltner emphasized the importance of risk management in trading. The upper and lower channel lines facilitate the setting of stop-loss orders, enabling traders to manage risk effectively.
8. Application in Various Markets:
Keltner Channels are not limited to a specific asset class. They can be applied to stocks, commodities, currencies, and other financial instruments, making them a versatile tool for traders across diverse markets.
Implementing the Keltner Channels Strategy
To leverage the advantages of the Keltner Channels indicator, traders follow a systematic approach:
Assess Market Volatility: Gauge market volatility by observing the width of the channels. Wider channels indicate higher volatility, while narrower channels suggest lower volatility.
Identify Trend Direction: Determine the prevailing trend by analyzing the position of the price in relation to the central moving average. A price above the CMA suggests an uptrend, while a price below indicates a downtrend.
Look for Breakouts: Monitor for breakouts above the upper channel as potential buying signals or breakdowns below the lower channel as potential selling signals.
Confirm with Other Indicators: Enhance the reliability of signals by confirming with other technical indicators. Combining Keltner Channels with oscillators or trend-following indicators adds depth to the analysis.
Set Clear Stop-Loss and Take-Profit Levels: Utilize the upper and lower channel lines to set clear stop-loss and take-profit levels, aligning with risk management principles.
Chester W. Keltner's legacy lives on through the enduring efficacy of the Keltner Channels indicator.
As traders navigate the ever-changing landscape of the stock market, this volatility-based tool provides a valuable framework for identifying trends, assessing market conditions, and making well-informed decisions.
Mastering the intricacies of the Keltner Channels can empower traders to harness the dynamics of market volatility and elevate their trading strategies to new heights in the dynamic world of stock trading.
Get alerted when stocks are triggered by a Keltner Channel buy signal: